How to Build a Real-Time Marketing Dashboard (Without Writing Code)
Spreadsheets and monthly reports are killing your marketing agility. Learn how to build a real-time dashboard that shows what's actually happening right now.

Paul Saunders
Founder, Smash It Marketing

Here's a scenario most business owners know too well:
You ask your marketing team how campaigns are performing. They promise a report by end of week. That report arrives as a PDF or spreadsheet. By the time you read it, the data is stale.
Meanwhile, your ad spend continues whether campaigns work or not.
The Problem with Monthly Reports
Traditional marketing reporting has a fundamental flaw: latency.
When you review last month's performance mid-way through this month, you're making decisions based on old information. By the time you identify a problem and implement a fix, weeks have passed.
In Google Ads, weeks of underperformance can cost thousands.
What Real-Time Actually Means
A real-time marketing dashboard shows:
Current ad spend: Not yesterday's, not this week's—today's.
Live conversion data: Leads and sales as they happen.
Performance trends: Are things improving or declining right now?
Budget pacing: Will you underspend or overspend this month?
ROI calculations: Actual return on investment, updated continuously.
When something goes wrong—a campaign tanks, conversions stop, budget burns too fast—you see it immediately.
The No-Code Approach
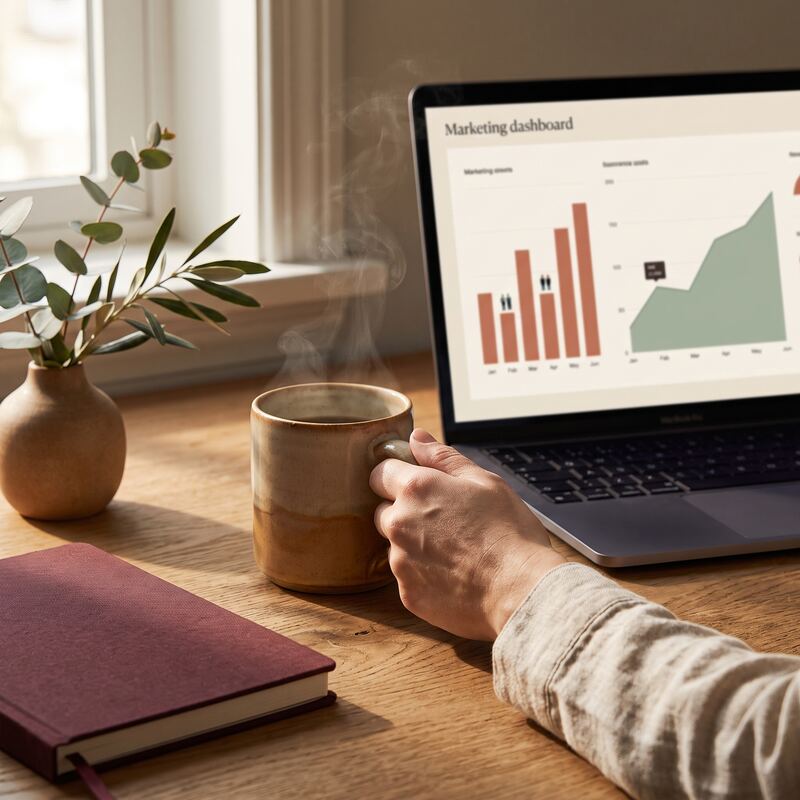
Several approaches exist for non-technical business owners:
Option 1: Google Looker Studio (Free)
Looker Studio (formerly Data Studio) connects directly to Google Ads and Analytics. It's free and surprisingly powerful.
Pros:
- Free
- Native Google Ads integration
- Customisable layouts
- Shareable with team members
Cons:
- Learning curve for custom configurations
- Limited to Google ecosystem without connectors
- Can become slow with complex dashboards
Option 2: Third-Party Dashboard Tools
Services like Databox, Geckoboard, and Klipfolio specialise in marketing dashboards. They offer pre-built templates and integrations.
Pros:
- Faster setup than custom builds
- Multiple platform integrations
- Professional templates
- Customer support
Cons:
- Monthly fees ($50-$500+)
- Some platforms require technical setup
- May include more features than needed
Option 3: Custom-Built Dashboards
For businesses with specific requirements, custom dashboards built on tools like Retool or Notion databases offer flexibility.
Pros:
- Exactly what you need
- Can include proprietary metrics
- Fully customisable
Cons:
- Higher initial setup time
- May need technical assistance
- Maintenance required
Essential Metrics for Your Dashboard
Whatever tool you choose, include these metrics:
Google Ads Metrics
- Total spend (today, this week, this month)
- Cost per conversion
- Conversion rate
- Impression share
- Quality scores
- Budget pacing
Website Metrics
- Sessions (real-time if possible)
- Bounce rate
- Goal completions
- Top landing pages
- Traffic sources
Business Metrics
- Leads generated
- Revenue from ads (if trackable)
- Cost per lead
- Return on ad spend (ROAS)
- Customer acquisition cost (CAC)
Setting Up Your First Dashboard
Here's a simplified process using Looker Studio:
Step 1: Create a Google Looker Studio account at datastudio.google.com
Step 2: Connect your data sources (Google Ads, Analytics)
Step 3: Add scorecards for key metrics (spend, conversions, CPC)
Step 4: Add time series charts showing trends
Step 5: Add comparison tables (this month vs last month)
Step 6: Share with relevant team members
Step 7: Set up as your browser homepage or schedule daily email updates
Common Mistakes to Avoid

No context: Raw numbers without comparison are meaningless. Always show benchmarks or time comparisons.
Set and forget: Dashboards need maintenance. Review quarterly and remove metrics you never act on.
Access too restricted: The people who can influence metrics should see the dashboard.
The Cultural Shift
A real-time dashboard changes more than visibility—it changes behaviour.
When the entire team can see live performance data:
- Marketing makes faster optimisation decisions
- Sales understands lead quality in real-time
- Leadership stops waiting for reports
- Accountability becomes automatic
Data on a screen changes the conversation from "what happened last month" to "what's happening now."
Getting Started
You don't need to build the perfect dashboard immediately. Start with:
- Core metrics only: Spend, conversions, cost per conversion
- One data source: Start with Google Ads or Analytics, not both
- Daily habit: Check the dashboard at the same time each day
- Weekly review: Refine what you're tracking based on what drives decisions
Add complexity only when the simple version becomes limiting.
Once the basics are running, the next step up is cross-referencing Search Console, GA4 and Google Ads so the three views of the same customer sit in one place. And if the goal is better communication rather than better numbers, a client workbench does more than a dashboard can.
Want help building a real-time marketing dashboard for your business? Our reporting & dashboards service can set up custom dashboards that connect to your Google Ads, Analytics, and CRM. Contact us to discuss your needs.
Paul Saunders
Founder of Smash It Marketing — a boutique, AI-first agency pairing 18 years of Google Ads with an AI-first service suite. Book a call.